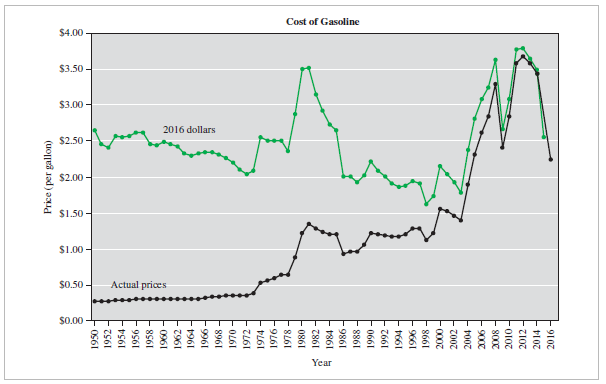
(15.) Review the graph shown below.
Adjusted for inflation, during which years during the period shown did the lowest gasoline prices occur?

The line graph in question is the one with a green color.
The lowest point in the line graph corresponds to the year 1998
Gas was cheapest in 1998–1999, because the graph shows that the price of a gallon of gas in 2016 dollars was at its lowest in that time period.
Adjusted for inflation, during which years during the period shown did the lowest gasoline prices occur?

The line graph in question is the one with a green color.
The lowest point in the line graph corresponds to the year 1998
Gas was cheapest in 1998–1999, because the graph shows that the price of a gallon of gas in 2016 dollars was at its lowest in that time period.
(16.) Suppose federal government spending for a popular housing program was $1 billion this year and
Congress has proposed increasing spending for the program to $1.03 billion for next year.
Assume that the Consumer Price Index is expected to rise by 7% over the next year.
Those who support the program complain that the program is being cut.
Those who oppose the program complain that the program is being increased.
Explain each position.
A. While the housing program gets an increase in actual dollars, when adjusted for inflation, the program gets the same amount of funding.
B. While the housing program gets a decrease in actual dollars, when adjusted for inflation, the program gets more funding.
C. While the housing program gets no change in actual dollars, when adjusted for inflation, the program gets a cut.
D. While the housing program gets an increase in actual dollars, when adjusted for inflation, the program gets a cut.
Compare the funding for the program for each year after taking into account inflation.
D. While the housing program gets an increase in actual dollars, when adjusted for inflation, the program gets a cut.
