Solved Examples on Investment Applications


Samuel Dominic Chukwuemeka (SamDom For Peace) Formulas Used: Mathematics of Finance
NOTE: Unless instructed otherwise;
For all financial calculations, do not round until the final answer.
Do not round intermediate calculations. If it is too long, write it to "at least" 5 decimal places.
Round your final answer to 2 decimal places.
Make sure you include your unit.


Solve all questions.
Use at least two methods where applicable.
Write the name of any formulas that you use.
Show all work.

For NSC Students
For the Questions:
Any space included in a number indicates a comma used to separate digits...separating multiples of three digits from behind.
Any comma included in a number indicates a decimal point.
For the Solutions:
Decimals are used appropriately rather than commas
Commas are used to separate digits appropriately.

(1.) Company A has 2 million shares outstanding and a share price of $9.
Company B has 20 million shares outstanding and a share price of $8.
Company C has 400,000 shares outstanding and a share price of $90.
Which company has the greatest market capitalization?

A. Company B has the greatest market capitalization.
Company B has a higher number of outstanding shares and a lower share price than the other two companies.

B. Company A has the greatest market capitalization.
The ratio of outstanding share to share price is the greatest for company A.

C. Company C has the greatest market capitalization.
The ratio of outstanding share to share price is the greatest for company C.

D. Company B has the greatest market capitalization.
Company B's outstanding shares and share price are in the middle range.
It's safer to choose a moderate number of shares and a moderate share price, rather than go to an extreme.

E. Company C has the greatest market capitalization.
Company C has a lower number of outstanding shares and a higher share price compared to the other two companies.

F. Company A has the greatest market capitalization.
Company A has a realistic amount of outstanding shares and a low share price compared to the other two companies.


Market capitalization = Total Number of Outstanding Shares * Current Share Price

$ \underline{Company\;A} \\[3ex] Market\;\;cap = 2000000 * 9 \\[3ex] = \$18,000,000 \\[3ex] \underline{Company\;B} \\[3ex] Market\;\;cap = 20000000 * 8 \\[3ex] = \$160,000,000 \\[3ex] \underline{Company\;C} \\[3ex] Market\;\;cap = 400000 * 90 \\[3ex] = \$36,000,000 \\[3ex] $ Company B has the greatest market capitalization.
It has a higher number of outstanding shares and a lower share price than the other two companies.
(2.) What is the price you pay for a bond with a face value of $8000 selling at 106 points?

A. It is $8630.
Divide the face value by 106 points.

B. It is $8480.
Divide the face value by 106 points.

C. It is $8310.
Divide the face value by 106 points.

D. It is $8480.
Multiply the face value by 106%.

E. It is $8630.
Multiply the face value by 106%.

D. It is $8310.
Multiply the face value by 106%.


D. It is $8480.
Multiply the face value by 106%.
(3.) Compute the total and annual returns on these investments.

(I.) Four years after buying 150 shares of XYZ stock for $80 per share, you sell the stock for $17,800

(II.) Five years after paying $3000 for shares in a startup company, you sell the shares for $1800 (at a loss).

(III.) You pay $6100 for a municipal bond.
When it matures after 17 years, you receive $11,500


$ (I.) \\[3ex] P = 150(80) = \$12000 \\[3ex] A = \$17800 \\[3ex] t = 4\;years \\[3ex] Total\;\;Return = \dfrac{A - P}{P} * 100\% \\[5ex] = \dfrac{17800 - 12000}{12000} * 100 \\[5ex] = 48.33333333\% \\[5ex] Annual\;\;Return = \left[\left(\dfrac{A}{P}\right)^{\dfrac{1}{t}} - 1\right] * 100\% \\[7ex] = \left[\left(\dfrac{17800}{12000}\right)^{\dfrac{1}{4}} - 1\right] * 100\% \\[7ex] = 10.35949108\% \\[3ex] $ Number 3-first

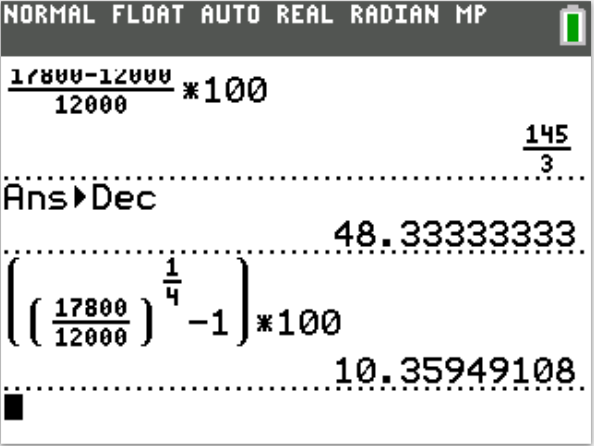
$ (II.) \\[3ex] P = \$3000 \\[3ex] A = \$1800 \\[3ex] t = 5\;years \\[3ex] Total\;\;Return = \dfrac{A - P}{P} * 100\% \\[5ex] = \dfrac{1800 - 3000}{3000} * 100 \\[5ex] = -40\% \\[5ex] Annual\;\;Return = \left[\left(\dfrac{A}{P}\right)^{\dfrac{1}{t}} - 1\right] * 100\% \\[7ex] = \left[\left(\dfrac{1800}{3000}\right)^{\dfrac{1}{5}} - 1\right] * 100\% \\[7ex] = -9.711954855\% \\[3ex] $ Number 3-second

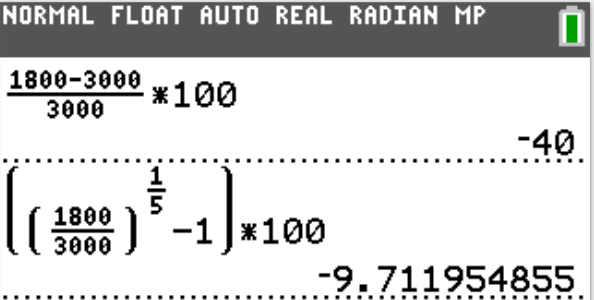
$ (III.) \\[3ex] P = \$6100 \\[3ex] A = \$11500 \\[3ex] t = 17\;years \\[3ex] Total\;\;Return = \dfrac{A - P}{P} * 100\% \\[5ex] = \dfrac{11500 - 6100}{6100} * 100 \\[5ex] = 88.52459016\% \\[5ex] Annual\;\;Return = \left[\left(\dfrac{A}{P}\right)^{\dfrac{1}{t}} - 1\right] * 100\% \\[7ex] = \left[\left(\dfrac{11500}{6100}\right)^{\dfrac{1}{17}} - 1\right] * 100\% \\[7ex] = 3.80018271\% \\[3ex] $
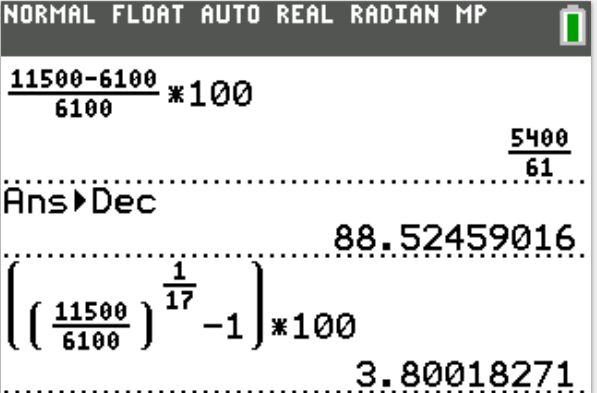
 Number 3-third
(4.)


(5.)


(6.)


(7.)


(8.)


(9.)


(10.)


(11.)


(12.)


(13.) The picture (stock table) is the information on the stock of Dollar General Corporation taken from the Yahoo Finance website in 2015.

Number 13

(a.) What were the high and low prices for the past 52 weeks?
(b.) How many shares were traded yesterday?
(c.) What were the high and low prices yesterday?
(d.) Based on the current price today and yesterday's closing price, verify the absolute change.
(e.) Based on the current price today and yesterday's closing price, verify the relative change.


(a.) The high price for a share of Dollar General stock during the past 52 weeks was $71.78
The low price for a share of Dollar General stock during the past 52 weeks was $53.00

(b.) 3,380,344 shares of Dollar General stock was traded yesterday.

(c.) The high price for a share of Dollar General stock yesterday was $67.24
The low price for a share of Dollar General stock during the past 52 weeks was $65.86

$ (d.) \\[3ex] Absolute\;\;Change = |Current\;\;Price - Previous\;\;Close| \\[3ex] = |67.01 - 67.06| \\[3ex] = |-0.05| \\[3ex] = \$0.05 \\[3ex] $ This verifies the amount in red on the picture.

$ (e.) \\[3ex] Relative\;\;Change = \dfrac{Absolute\;\;Change}{Previous\;\;Close} * 100 \\[5ex] = \dfrac{0.05}{67.06} * 100 \\[5ex] = 0.0745601\% \\[3ex] \approx 0.07\% \\[3ex] $ This verifies the amount in red on the picture.
(14.) Data on the percentage of jobs that require various levels of education are displayed in the following bar chart and pie chart.


(15.)


(16.)


(17.)


(18.)


(19.)


(20.)


Top


(21.)


(22.)


(23.)


(24.)


(25.)


(26.)


(27.)


(28.)


(29.)


(30.)